| |
Cluster Analysis for ENSO Events using HYSPLIT
|
The previous cursory examination of the decadal cluster mean trajectories
suggested that there might be an ENSO effect in the tropical Pacific region.
To determine what such trajectory clusters might look like, the existing database
of trajectories was partitioned into two periods, months that showed
either an El Niño or La Niña influence. This was determined by
using the existing partition developed by
the NOAA's Physical Sciences Laboratory for the top 24 strongest events.
The cluster analysis was limited to the years 1950 through 2014. The calculations
shown here are for only one location: 0N 150W.
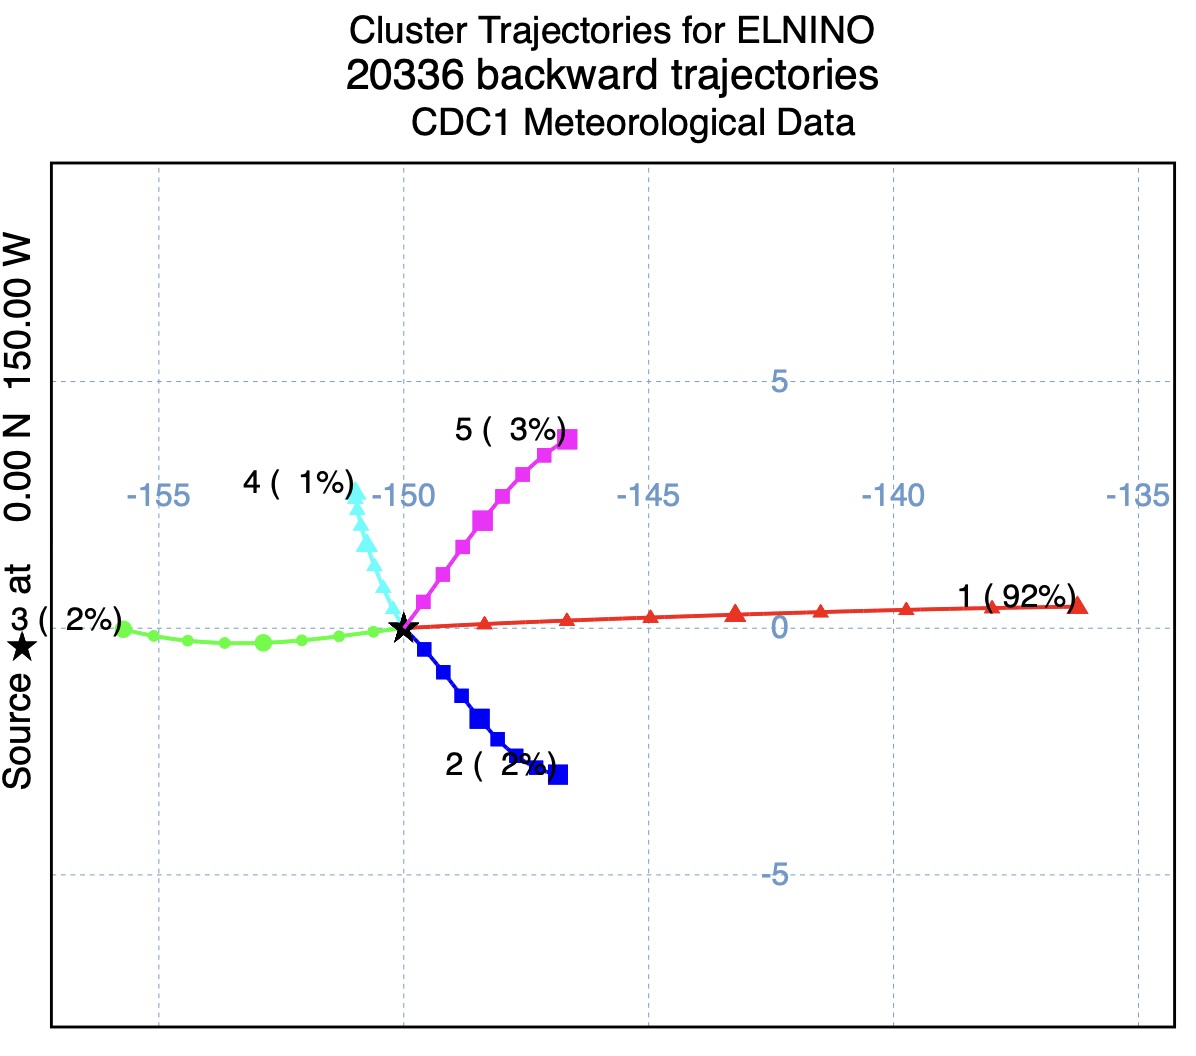
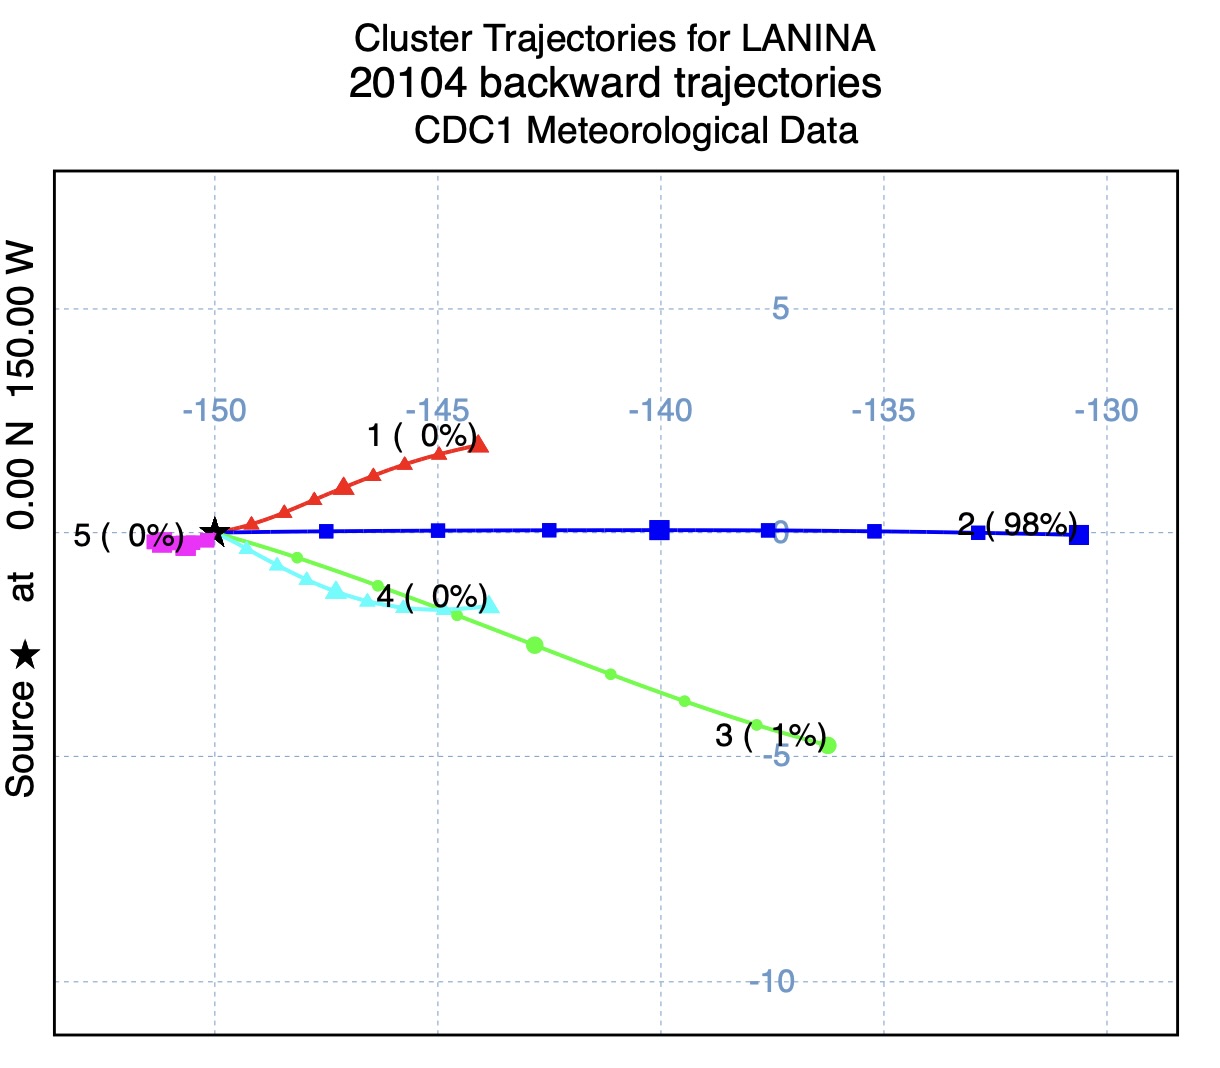
The two tables and figures shown below are for the El Niño periods
on the left and the La Niña periods on the right. In both cases the flow
was dominated by the eastern trades with 92% of the trajectories during
El Niño periods and 98% of the trajectories during La Niña periods.
The remaining flow periods showed much more directional variability during
El Niño and with much lower wind speeds, averaging 8.7 m/s for
cluster #1, compared with 12.0 m/s for cluster #2 during the La Niña months.
The trajectories for this analysis had already been
precomputed for
the decadal clustering study. The data extraction and clustering for other locations
using the ENSO filter in not currently available through the web interface.
| El Niño (167 months) | La Niña (165 months) |
 |  |
Cluster
Numb | Percent
| Duration
(h) | Temp
(oC) | Press
(hPa) | H2O
(g/kg) | Wspd
(m/s) |
|---|
�
1 | 91.8 | 634.0 | 16.4 | 849.3 | 10.2 | 8.7 | �
2 | 2.3 | 24.1 | 17.1 | 849.8 | 9.7 | 3.8 | �
3 | 2.2 | 63.2 | 17.4 | 849.9 | 10.4 | 4.4 | �
4 | 1.0 | 21.6 | 17.3 | 849.8 | 9.9 | 3.5 | �
5 | 2.7 | 22.7 | 17.0 | 849.9 | 9.9 | 4.0 | �
Mean | 100.0 | 261.9 | 16.5 | 849.3 | 10.2 | 8.3 |
| Cluster
Numb | Percent
| Duration
(h) | Temp
(oC) | Press
(hPa) | H2O
(g/kg) | Wspd
(m/s) |
|---|
�
1 | 0.3 | 20.5 | 15.4 | 850.0 | 9.8 | 5.0 | �
2 | 98.0 | 1040.3 | 14.8 | 848.8 | 9.4 | 12.9 | �
3 | 1.4 | 15.8 | 15.2 | 850.2 | 8.7 | 10.1 | �
4 | 0.2 | 13.7 | 15.3 | 849.7 | 9.1 | 4.8 | �
5 | 0.1 | 30.0 | 14.6 | 848.6 | 9.4 | 3.7 | �
Mean | 100.0 | 562.1 | 14.8 | 848.9 | 9.4 | 12.8 |
|